

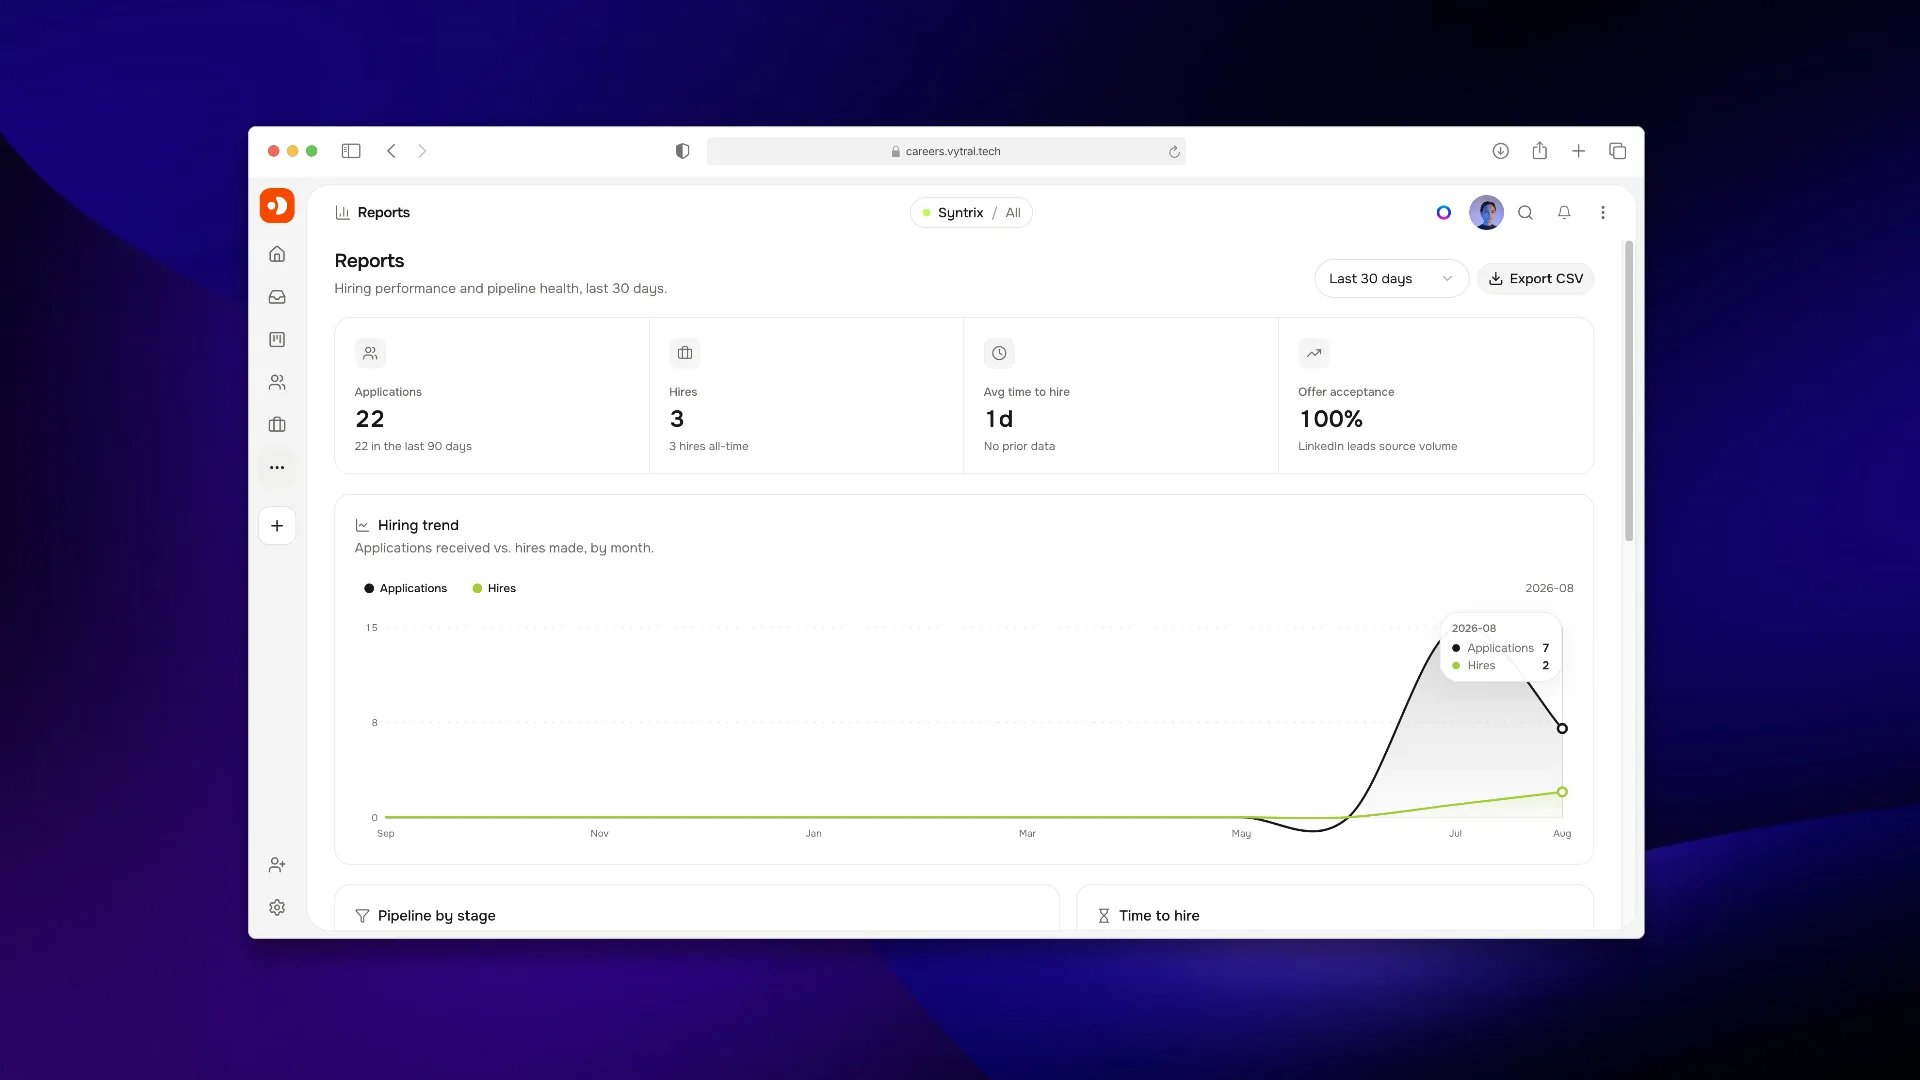
Hiring performance, pipeline health, and time-to-hire reporting.
What you can measure
Pipeline health
Pipeline health shows how many applications sit in each stage per job, so you can see bottlenecks before they become stale candidates.Hiring velocity
Source and outcome
Reading a report
1
Choose a report
Open Reports in the sidebar and select the report type.
2
Apply filters
Filter by job, department, date range, or owner to scope the view. A
narrow filter is usually more useful than a workspace-wide aggregate.
3
Interpret the data
A number is a prompt to look, not a verdict. High age-in-stage means you
should look at what is blocking those applications — it does not mean
those candidates are unqualified.
4
Act on the record
Open the underlying applications from the report view. A report is read-only;
changes happen on the pipeline.
Export and API
For custom analysis or dashboards outside Harly, use the API:Next steps
Candidates and pipeline
The records reports are built from.
API overview
Export data programmatically for custom dashboards.
Privacy
Handle exports and retention compliantly.
Automations
Automate actions triggered by pipeline events.